
10% in October, whilst tech stocks in particular, took a hammering with Amazon falling 23% and Netflix crumbling 26%.
November saw equities starting to claw back before Bitcoin collapsed over 80% from it’s all-time high…ouch! Meaning a 400% gain would now be required to get back to it’s high:
| Loss % | Gain required to recover |
| 5% | 5.3% |
| 10% | 11.1% |
| 15% | 17.6% |
| 20% | 25% |
| 25% | 33.3% |
| 30% | 42.9% |
| 40% | 66.7% |
| 50% | 100% |
| 60% | 150% |
| 70% | 233% |
| 80% | 400% |
| 90% | 1000% |
Furthermore, for many of you, it would have been the first time you’ve seen a real correction, how are you supposed to act?
Let alone continue to invest when there’s panic rising?
Had enough of the doom and gloom? Good, me too! Let’s get stuck in…
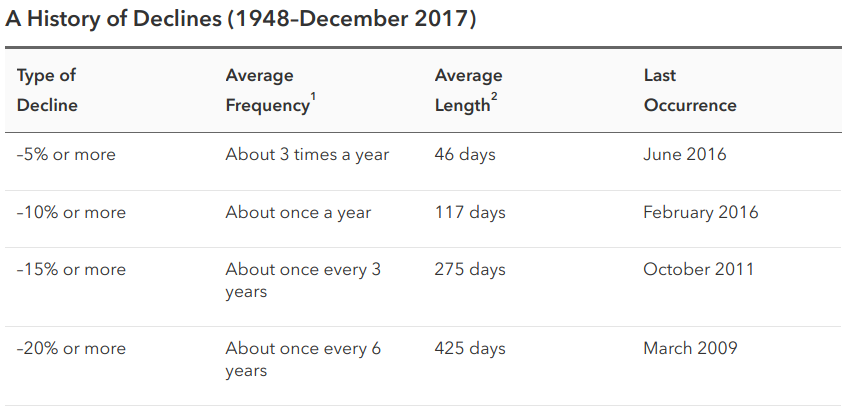
Whilst worldwide equities have seen consistent growth over the past few years, by zooming out we see declines are a reoccurring theme in economic history:
 Via American funds
A decline of 15%+ has occurred about every 3 years since 1948! Yet until recently the S&P 500 had not seen such a correction since 2011.
Here’s the deal:
All we are experiencing is normality when we zoom out far enough.
If you’ve been shaken by the volatility tree recently, you likely spotted the bottom row in the above image, mentioning a crash of 20% or more….
Last seen in 2009…
Historically seen once every 6 years…
2009+6=2015
Current year = 2018
¯\_(ツ)_/¯
So does this mean such a stock market crash is due?
Not necessarily, since these are just averages. But it’s certainly worth keeping in mind. So how might you protect yourself?
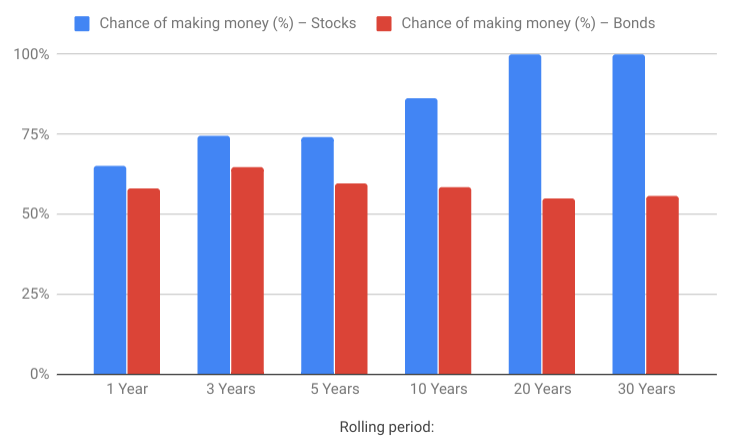
Since market declines are a normal part of cyclical economic machines, it’s worth considering the frequency of these and the likelihood you would have made money over different time periods.
Combining this data with historical returns and comparing against other asset classes we start to see an interesting picture.
| Rolling period: | 1 Year | 3 Years | 5 Years | 10 Years | 20 Years | 30 Years |
| Chance of making money (%) – Stocks | 65% | 74.7% | 74.0% | 86.1% | 100.0% | 100.0% |
| Chance of making money (%) – Bonds | 58% | 64.6% | 59.7% | 58.3% | 54.8% | 55.8% |
| Average yearly return stocks | 7.9% | 6.6% | 6.7% | 6.9% | 7.1% | 6.8% |
| Average yearly return bonds | 2.2% | 1.8% | 1.7% | 1.4% | 1.0% | 1.1% |
| Volatility – Stocks | 20.7% | 11.3% | 8.5% | 5.9% | 3.8% | 1.7% |
| Volatility – Bonds | 9% | 5.6% | 4.6% | 3.7% | 2.7% | 2.7% |
S&P 500 data averaged and computed via Money Nest from 100 years (1908-2008) of raw data published at the Stern School of Business (NYU). Inflation is calculated as the Consumer Price Index (CPI). Data provided by the Federal Reserve Bank of St. Louis.
This tells us no matter what year you invested in, any 1 year period would have yielded a 65% chance of making money in stocks (that’s actually pretty good! And almost certainly a positive expected outcome).
It gets better…
As your time horizon lengthens, your chance of making money increases plus you get the added benefit of volatility reducing as time mellows it.
Look at your historic chance of making money on an annual basis over 10 years compared to 1 year…it jumps from 65% to 86% and volatility drops from 20.7% to 5.9%.
Finally, note that returns actually decreased for Bonds since the real returns are lower than inflation.
If historically your chance of making money has been good you might be interested in investing in equities, but what in exactly? Well, what if I told you…it didn’t really matter…
In 1986 a now landmark study was published which made a huge impact on the financial planning world.
This study discovered approximately 90% of investment returns can be traced back to the asset allocation selected (e.g 80% in stocks and 20% in bonds) rather than the individual investments picked (e.g. Stock A or Stock B).
Want to know the best part?
Even timing the market only slightly moved the needle.
When you consider how long people spend agonising over whether now is ‘the right time to invest’ or whether to invest in stock A or B, isn’t that incredible!? To reiterate…
90% of investment returns are correlated to your asset allocation, not the individual choices!
Yet at a guess, I’d say 90% of people investing spend no time whatsoever considering how much to invest in each basket.
Through understanding and setting out an asset allocation that’s appropriate for your situation, you can potentially reduce the impact that market corrections and recessions have on your portfolio.
Plus! By going through the process, you’ll naturally develop more clarity on the markets leading to less panic when one or more of your investment classes witness a sell-off.
If you’re interested in learning more, you may find the post I wrote entirely on the subject of asset allocation useful.
Or, if you’re looking for a method that’s historically reduced the impact of market crashes read on…
Pound cost averaging means investing the same numerical amount of money each month, every month, leading to you buying less when it’s expensive and more when it’s cheap.
Let’s say for example John invests £100 a month in an index fund.
September it was sold at £50 per unit, meaning he purchased two units.
October saw the price rise to £60 per unit – so he now buys 1.66 units (£100/£60).
In November it crashes to £20 per unit, so this time his £100 gets him five units (£100/20).
Here’s a breakdown:
| Month | Cost per unit | Units purchased |
| September | £50 | 2 |
| October | £60 | 1.66 |
| November | £20 | 5 |
Total spent: £300
Total units purchased: 8.66 units
Now compare this to Billy who simply purchased £300 of the same investment in one go:
| Month | Cost per unit | Units purchased |
| September | £50 | 6 |
| October | £60 | 0 |
| November | £20 | 0 |
Total spent: £300
Total units purchased: 6 units
What’s the bottom line?
Both spent the same amount, yet as John pound cost averaged in, he was able to end up with 44% more units than Billy.
| Name | Spend | Units owned |
| John | £300 | 8.66 |
| Billy | £300 | 6 |
Whilst the prices showed extreme volatility, even with small market movements the differences really add-up.
Over a 30 year period for example pound cost averaging has historically increased annual returns from 7% to 10.20% (shown within the lock section).
Even still, it’s still going to be painful when you experience your first market correction so it’s worth finally considering mental preparation…
By arming myself with information on economic history, average returns and the impact of volatility, I’ve been able to develop a mental fortitude of positivity towards long-term investing with an understanding that short-term volatility is totally normal.
This has enabled me to push my reactions away from my natural human biases which tend to nudge me to make the worst decisions at the worst of times.
Ultimately allowing me to check my investments less, act less on impulse and get on with my life without worrying about what the papers say (did someone say Brexit and house prices?!).
To increase your mental fortitude, I recommend at the very least:
Taking it a step further, Van Tharp a leading trading coach recommends his traders create a plan for worst-case scenario’s and actually mentally rehearse them, so when they do occur, strategical decisions can be made rather than emotional fuelled impulses.
I think there’s a lot we can learn from that.
Corrections and recessions are a normal part of the economy and if you’re investing for long enough, they’re almost certain to raise their head in your direction.
Yet by understanding this is normal, working on your asset allocation, pound cost averaging and having the right mental preparation, history would suggest you’ll end up prospering in the long-term, despite what the markets bring your way between.
Enjoyed this post? Enter your email below to get notified when our next post drops: