


Bill Gates is famous for the quote: ‘Most people overestimate what they can do in one year and underestimate what they can do in ten years’…investors are often guilty of exactly this.
This manifests itself through our emotions in two ways:
Commonly due to an investment making low or negative returns (enhanced if the low return period is within the first years of investing).
Normally caused by placing an investment with an assumption you’ll get abnormally high returns because that same investment saw abnormally high returns prior to you investing in it…
Then feeling fearful & frustrated when it doesn’t pan out that way.
Yet there remains a powerful investing truth that when deeply appreciated can change your mindset to allow a continuation to invest, however stormy the investment winds blow.
I’ll warn you…it’s so simple you probably already know it…
The chart below (via Reddit) showcases this brilliantly. Note how years invested (in this case US Stocks) correlates directly with higher returns. The green lines represent different investment performances over time, whilst the black trend line presents an upward trend.
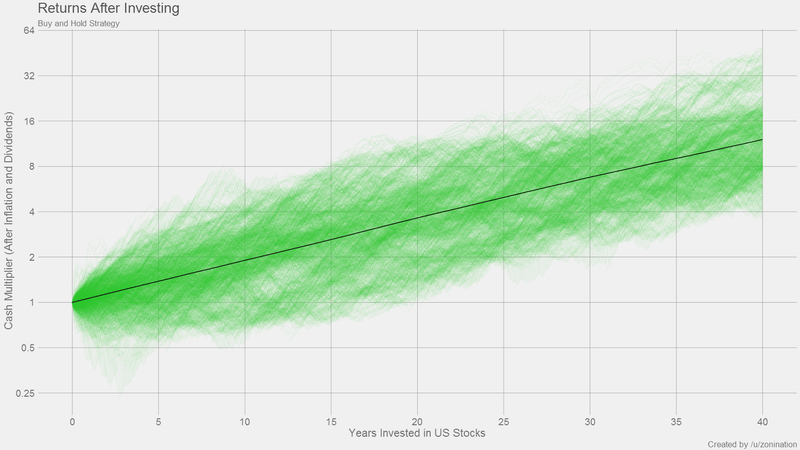
Look more closely and you’ll notice those upward trending green lines don’t move in a linear path, instead, they wriggle all over the place as short-term volatility occurs. It is this that leads to emotional decisions…
Whilst the chart shows a rosy upward trend it doesn’t display the short-term volatility that’s responsible for the deep emotions of fear and greed we encounter during stormy times.
Below is a table created with data from S&P 500 going back to 1928 (data via Stern Business School – NYU):
| Rolling 25-year compound annual return | Rolling 5 year compound annual return | |
| Average | 11.37% | 10.27% |
| Best case | 17.10% | 28.29% |
| Worst case | 5.22% | -12.71% |
Furthermore, the worst case period for rolling 25-year periods shows +5.22% return, meaning no matter what year you began investing (even during the great depression) if you invested over a 25 year period your average year would have always been positive.
Awesome! Until we see the best 25-year period (17.10%) is a whopping 228% more than the worst case period (5.22%). Meaning an investment of £5,000 (with no further additions) would grow to £226,032 in the best case scenario but just £44,921 in the worst.
So can we get the £226k rather than the £44k…?
[bctt tweet=”History doesn’t repeat itself but it often rhymes – Mark Twain #personalfinance #money #investing” username=”ukmoneynest”]
We can’t predict exactly when to enter the markets but we can use a simple mathematical principle to dramatically bolster our returns.
Introducing: Pound cost averaging.
Pound cost averaging means rather than making an initial lump sum investment, you spread your initial investment over a number of months (usually 6-12) to avoid early large losses since early large losses can dramatically impact your final balance (if investing a lump sum).
Let’s say you unexpectedly inherit £10,000 from your late aunt Gertrude, rather than investing all this in month 1 you split it by six months and invest 1/6th each month:
Month 1 – Invest £1666.66
Month 2 – Invest £1666.66
Month 3 – Invest £1666.66
Month 4 – Invest £1666.66
Month 5 – Invest £1666.66
Month 6 – Invest £1666.66
Total: £10,000
This allows you to drip feed your investment into the market, meaning large market pullbacks (price drops) have a less of an impact on your return.
Naturally, if the market went up 5% in the first month, you’d miss out on the extra return (since you’d get 5% of £1,666 rather than 5% of £10,000) yet more often than not this ‘insurance cost’ is far better to have than a decimated investment balance in month 2.
In the table below I’ve taken the worst compound annual returns since 1928 (using DQYDJ’s calculator) for rolling periods of 10, 20 and 30 years and added in a second column showing what your average annual return would be had you pound cost averaged in during the same period.
| Period | Annual return | Pound cost averaging annual return | Diff % |
| 10 Year | 4.83% | -3.65% | -175.63% |
| 20 Year | 2.98% | 5.68% | 90.63% |
| 30 Year | 7.09% | 10.20% | 43.81% |
Figures assume an initial investment of £500 and a monthly investment of £500
Pound cost averaging makes a 90% increase in your average annual return through the 20 year period and a 43% positive difference in your average annual return over the 30 year period (1928-1958). Now that’s the kind of Math I like!
The more eagle-eyed readers will spot the 10 year period is worst when pound cost averaging. I consider this an exception due to the time period (1922-1932) meaning you’d make most of your monthly investments during the great depression and then pulled your money out before the roaring 1930’s kicked in.
[/emaillocker]


Pound cost averaging really comes into its own when making the same fixed priced investment every month, since not only do you invest significantly more in the long term but you also buy less when the market is ‘expensive’ and more when it’s cheap, creating a smoothing effect on your returns.
In the table below I’ve taken the worst compound annual returns since 1928 (using DQYDJ’s calculator) for rolling periods of 10, 20 and 30 years and added in a second column showing what your average annual return would be had you pound cost averaged in during the same period.
Figures assume an initial investment of £500 and a monthly investment of £500
Pound cost averaging makes a 90% increase in your average annual return through the 20 year period and a 43% positive difference in your average annual return over the 30 year period (1928-1958). Now that’s the kind of Math I like!
The more eagle-eyed readers will spot the 10 year period is worst when pound cost averaging. I consider this an exception due to the time period (1922-1932) meaning you’d make most of your monthly investments during the great depression and then pulled your money out before the roaring 1930’s kicked in.
[/sociallocker]
Make friends with volatility
Recency bias is a term in investing to represent how our mind anchors against recent market behavior to assume it will continue in its current form, take for example the stock market drop in late January which came as the first 5% drop since June 2016.
This caused a shock for many investors yet in actuality on average every year the Dow Jones Industrial Average drops by 5% (or more) on three separate occasions. Take this into account, reframe your thinking and you’ll discover it was a surprise the correction didn’t take place earlier!
It’s in these times that the short-term emotional decisions we make can have a huge impact on your long-term investing success.
An example of how emotional decisions lead to negative investment performance is showcased brilliantly by the rumoured study by Fidelity that found investors with the biggest returns over a 10 year period all belonged to customers who’d forgotten they had accounts, meaning any potentially detrimental emotional decisions simply had never taken place.
So what is normal? American funds produced the following table to showcase average market corrections since 1948:
Note the final row -20% or more decline, every 6 years, last seen in March 2009. Interesting….
Before you start selling all your possessions in anticipation of that -20% decline (‘overdue’ since 2015), understand these are just averages.
For example time between recessions has been longer than 12 years in four out of the ten bull markets and even as long as just under 14 years in the longest case (since the 1920’s).
So if we have a repeat of that period we’ve got another 5 years of a bull run (or even longer if we continue to break records) to look forward to, we just don’t know for sure.
What we do know is whilst the market will be volatile, if we use our friends time and pound cost averaging one day we may just pat ourselves on the back for investing.